A continuous timeline diagram for PowerPoint that illustrates ongoing projects, workflows, or sequential steps with clarity, editable layouts, and bold visuals for impactful business presentations.
Get this diagram:
About This Diagram
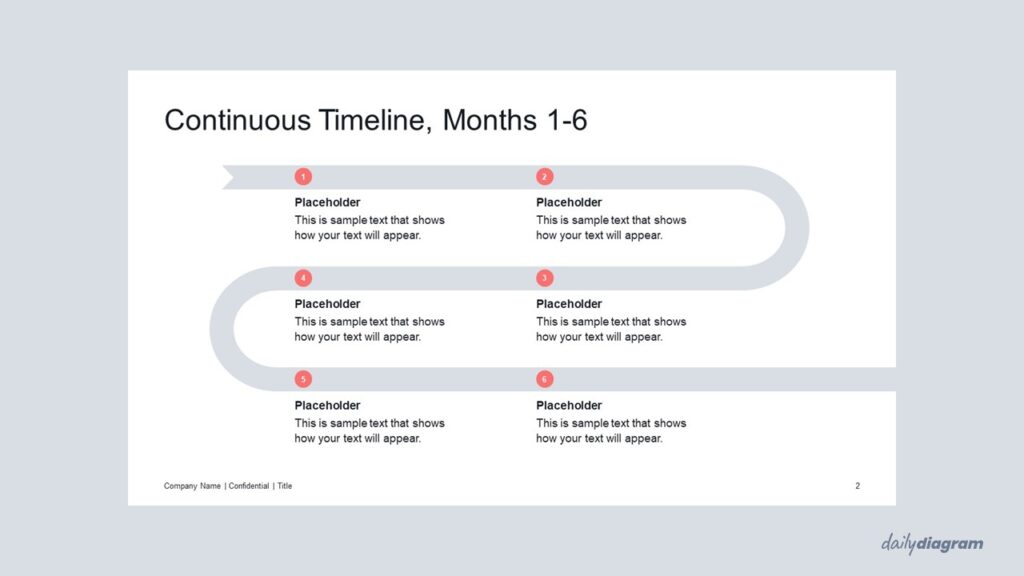
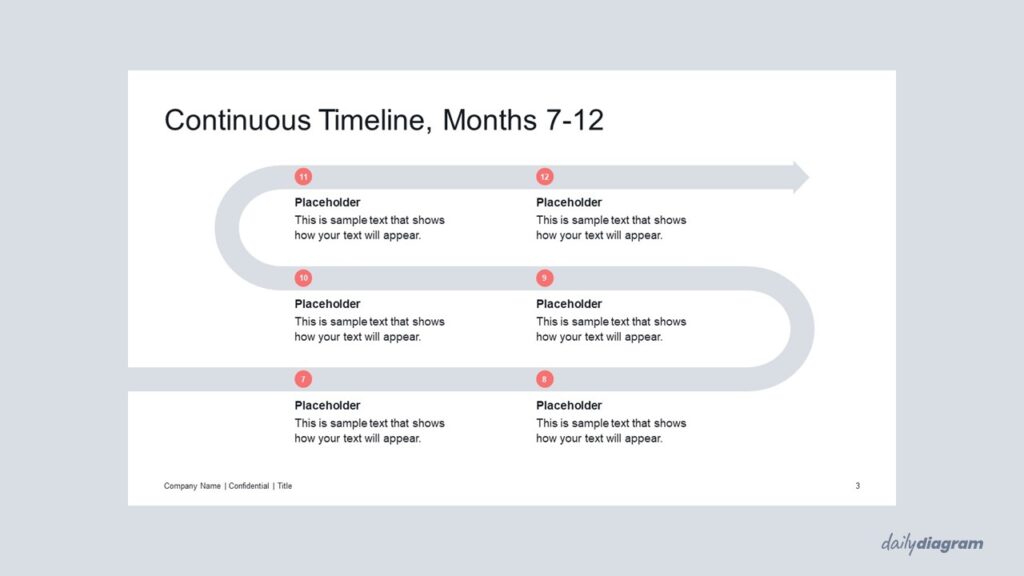
The continuous timeline infographic is designed for presentations where one slide isn’t enough to capture the full sequence of events. By extending the line across two slides, it creates a seamless flow that helps audiences follow long-term projects, strategic plans, or detailed workflows without interruption. This structure works especially well when you need to keep information visually connected while maintaining clarity across multiple slides.
Fully editable in PowerPoint, it allows quick adjustments to colors, shapes, and text, ensuring it fits your style and presentation needs. The bold layout not only highlights progress but also emphasizes continuity, making it ideal for project updates, roadmaps, and professional business contexts.
If you’re looking for a wider variety of single-slide timeline layouts in a similar style, take a look at Timeline Arrow Set #1.
Key Features & Specs
Universal Features
- Fully Editable: Easily change text, colors, and layouts to match your needs.
- 16:9 Aspect Ratio: Optimized for modern screens and presentations.
- High-Quality Visuals: Professional, clear design that looks polished in any context.
- Structured Object Naming: All elements are neatly labeled in the Selection Pane for fast, intuitive editing.
- Multi-Purpose: Ideal for meetings, projects, strategy sessions, and personal organization.
- PowerPoint Ready: Works entirely within PowerPoint; no extra software needed.
- Google Slides Compatible: Most diagrams can be used in Google Slides by opening the .ppt file. Some advanced effects (like text transforms or animations) may not be fully supported.
Diagram-Specific Features:
- Represent ongoing events or processes seamlessly in editable diagrams.
- Suitable for long-term projects and professional presentations.