A bold cycle arrow diagram for PowerPoint that helps visualize recurring processes, circular workflows, or continuous steps with clarity, flexibility, and strong visual impact for presentations.
Get this diagram:
About This Diagram
The cycle arrow diagram is a bold and versatile PowerPoint infographic designed to clearly visualize recurring processes, circular workflows, or repeating steps.
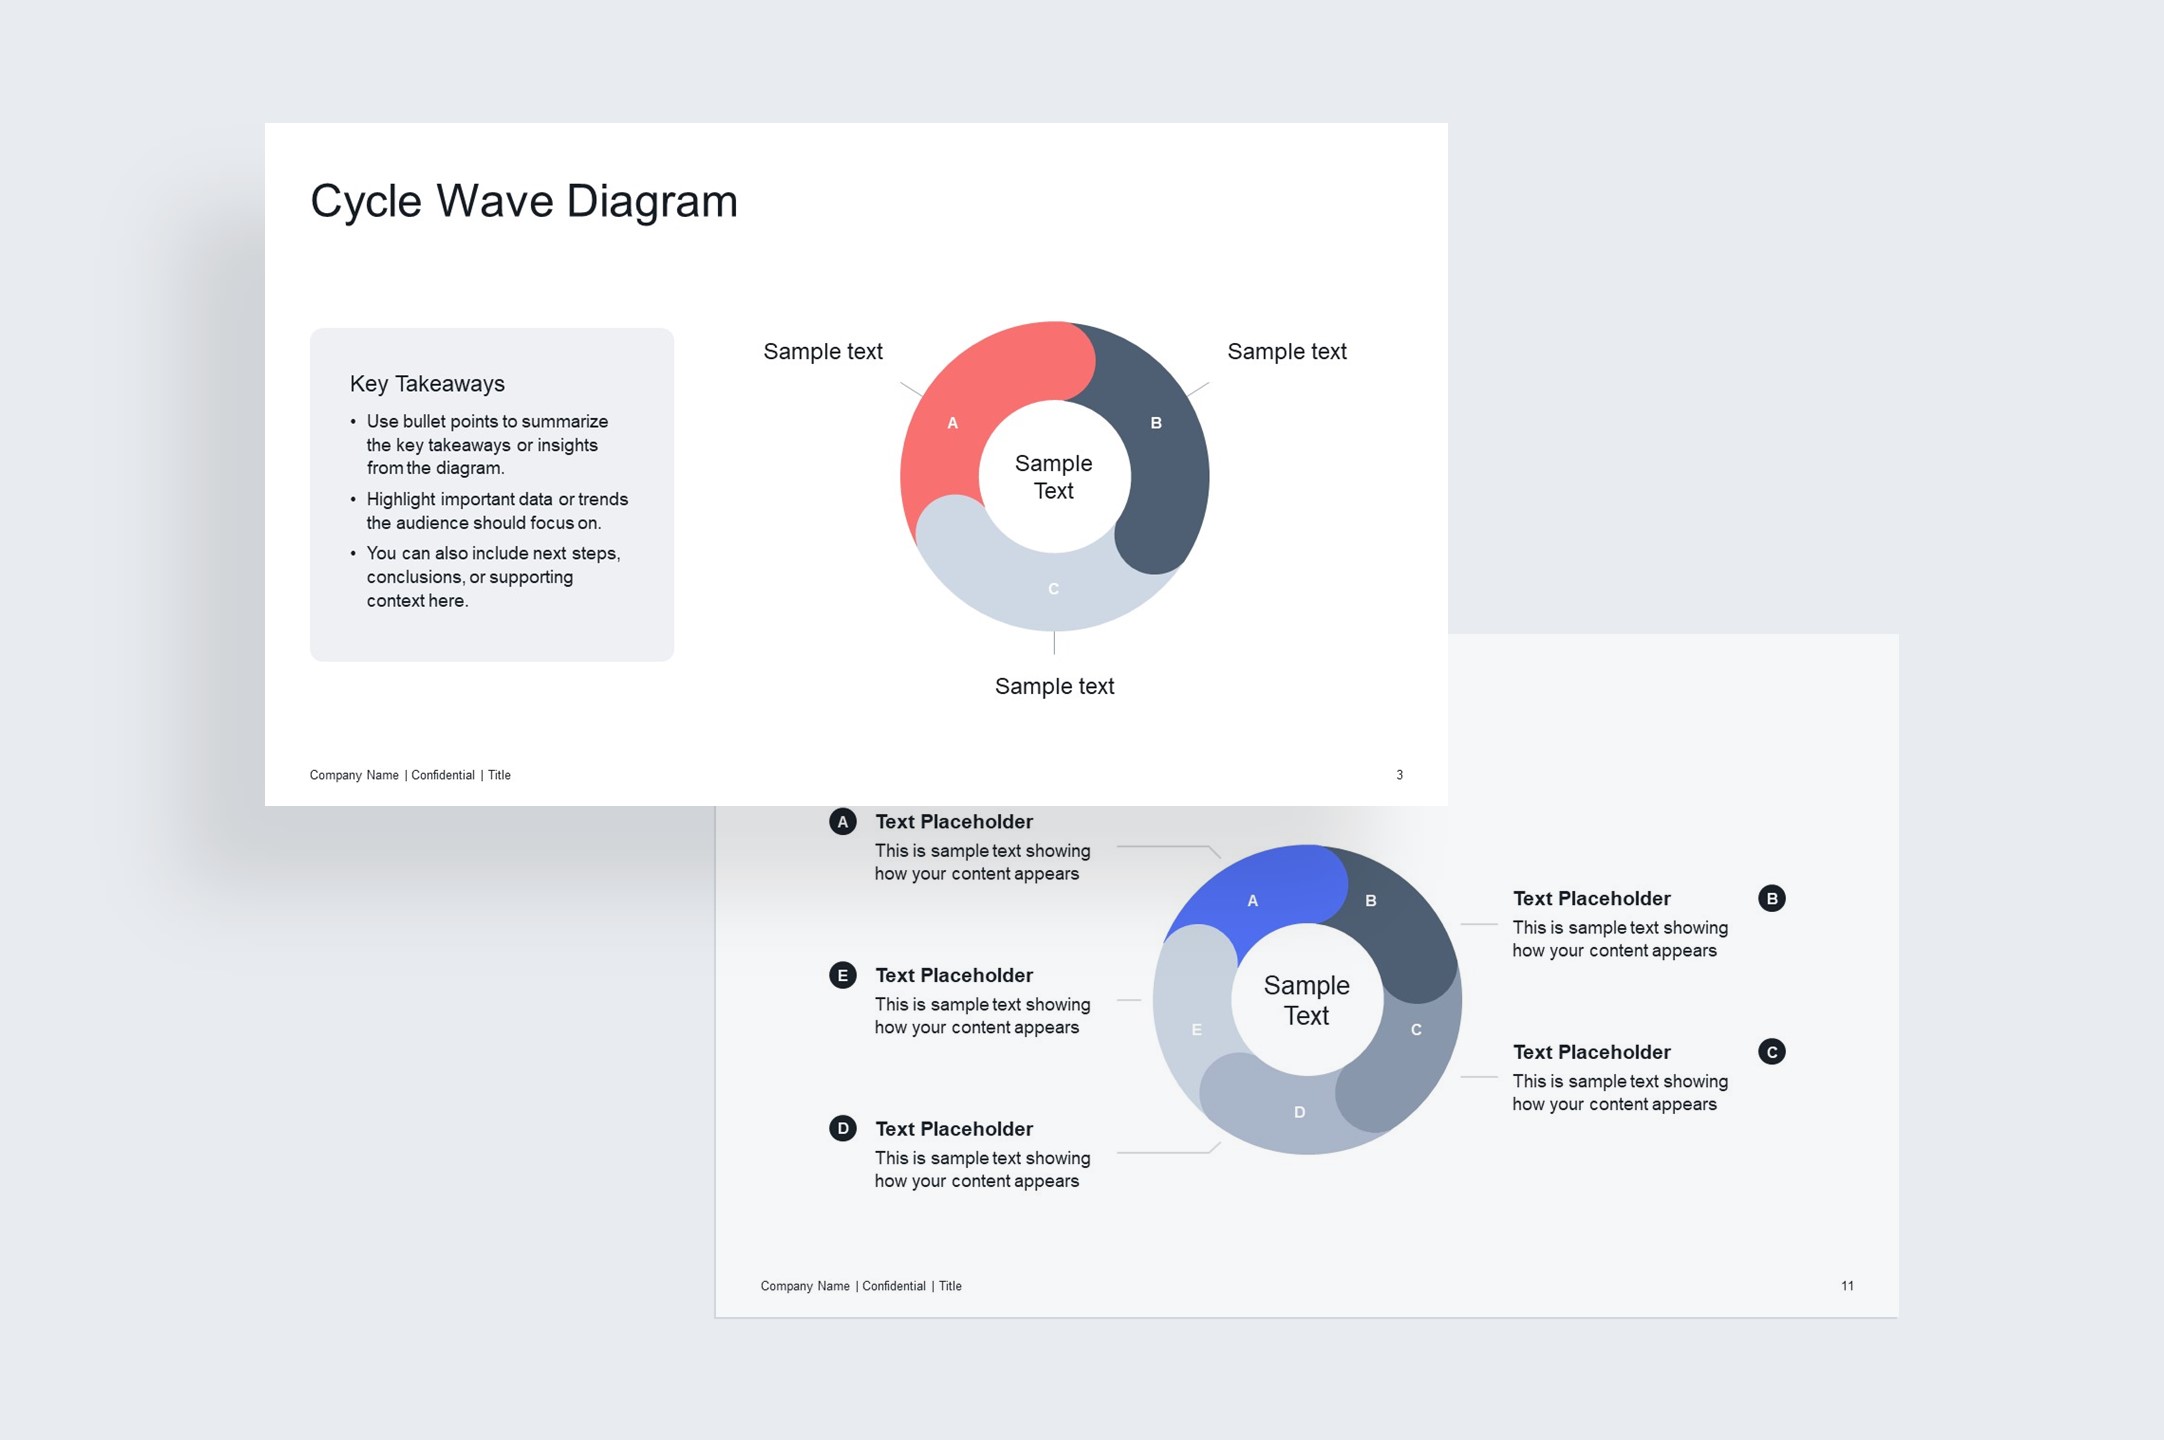
It includes 2–6 segment diagrams with two layout variations, making it easy to adapt to different presentation needs. Layout 1 places the diagram on the right with space for key takeaways on the left, while Layout 2 centers the diagram with expanded room for segment descriptions.
Each segment can accommodate icons or short text, helping to highlight key points effectively. Fully editable, you can adjust colors, size, and position of each part to match your brand or presentation style.
This diagram is ideal for project planning, process overviews, or illustrating continuous improvement cycles, making complex ideas simple and visually engaging.
For a similar cycle diagram with wave-shaped segments, try the Cycle Wave Diagram.
Key Features & Specs
Universal Features
- Fully Editable: Easily change text, colors, and layouts to match your needs.
- 16:9 Aspect Ratio: Optimized for modern screens and presentations.
- High-Quality Visuals: Professional, clear design that looks polished in any context.
- Structured Object Naming: All elements are neatly labeled in the Selection Pane for fast, intuitive editing.
- Multi-Purpose: Ideal for meetings, projects, strategy sessions, and personal organization.
- PowerPoint Ready: Works entirely within PowerPoint; no extra software needed.
- Google Slides Compatible: Most diagrams can be used in Google Slides by opening the .ppt file. Some advanced effects (like text transforms or animations) may not be fully supported.
Diagram-Specific Features:
- Includes 2 layout variations: centered and sided positions, perfect for PowerPoint diagram templates.
- Visualize repeating processes or continuous improvement cycles clearly in editable slides.